New research paper
Review of data on hoof growth in normal and laminitic equines suggests a new aetiology for acute laminitis, by Tom Ryan FWCF
This paper is based on hoof growth measurements taken by Tom and is the basis for many of the extended concepts presented on this website. The paper is not copyrighted and can be downloaded and shared.
Read / DownloadHoof growth in normal & laminitic horses
An earlier interpretation of hoof growth data
by Tom Ryan FWCF
Introduction
The rate at which the hoof grows has been variably placed at .102 mm per day (Summinger 1977) to .506 mm per day (Butler 1976). Adams 1974 stated that growth was .204 mm per day. To date only limited detailed studies of hoof growth have been carried out. Shannon and Butler (1979) found that hoof growth was faster in young horses than in adults. They also commented on a change in growth rate which was fastest in warmer temperatures and greater rainfall. Butler and Heintz (1977) observed the affect of food intake on two groups of horses and found that unlimited food intake resulted in twice the horn growth over the group receiving limited feed. Grade and Saltzmann concluded that the angle to which the hoof was trimmed could also affect growth rates. No detailed study of growth rate of horses feet in the United Kingdom has been found nor have detailed long term studies of growth rate of the feet of horses with chronic laminitis been published.
Materials and Methods
Twenty horses and ponies were selected, the 4 ponies having chronic laminitis of long standing duration. During the period of this survey 7 animals were sold or moved away from the area, and so final results are based on 13 animals. All the horses involved were privately owned and kept at different locations in Bedfordshire, England. The criteria for selection of the animal was the reliability of the owner and the availability of the horse for measurement on a regular monthly basis. The animals were divided into two groups, group 1, being normal horses and group 2, ponies with chronic laminitis (see tables 1 & 2).
Table 1 - Horses and ponies with normal feet
| Name | Height | Type | Sex | Age(at start) |
|---|---|---|---|---|
| Bracken | 14.3 | Cob | Gelding | 9 |
| Harrier | 14.2 | X Cleveland Bay | Gelding | 2 |
| Juba | 14.3 | Pony | Mare | 10 |
| Magic | 15.2 | X Thoroughbred | Mare | 5 |
| Smokey | 13.2 | Pony | Gelding | 10 |
| Snoopy | 15.2 | Cob | Gelding | 16 |
| Star | 14.3 | Pony | Mare | 8 |
| Starling | 14.2 | Cob | Gelding | 20 |
| Taffy | 15.0 | Cob | Gelding | 20 |
| Zonda | 14.2 | Arab X Pony | Gelding | 2 |
Table 2 - Ponies with chronic laminitis
| Name | Height | Type | Sex | Age(at start) |
|---|---|---|---|---|
| Pinky | 12.0 | Pony | Mare | 15 |
| Ronas | 9.3 | Shetland pony | Gelding | 8 |
| Tara | 12.1 | Pony | Mare | 11 |
All the animals were kept at grass throughout the year except in the winter months when most were stabled through the night.
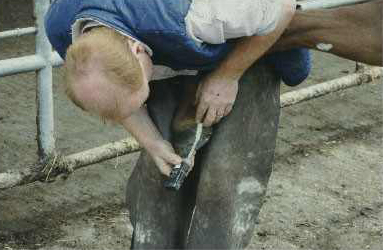
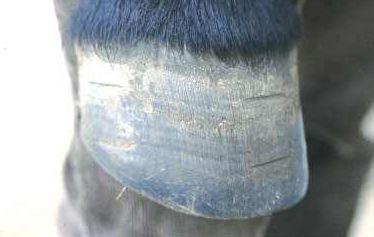
Measurements were made on all four feet of each animal, measuring the growth rate of each heel and toe of all four feet. In order to obtain measurements a horizontal line was filed into the hoof wall on the dorsal surface and at each heel. Measurements were then made from this line to the distal hairline at the coronary band. As the line grew out of the foot it was replaced by a new line, and measurements made accordingly. Measurements were made every 28 days commencing on 25th April 1984 and concluding on 27th March 1985. Measurements were made in millimetres.
A total of 144 measurements were made on each horse in the course of the twelve months study. A mean growth rate was plotted for each group and comparisons were made regarding, overall growth in each group, rates of growth between front and hind feet and toe and heel, and medial and lateral heel growth. Significance of the results was assessed using students T test between the related groups.
Results
Figure 1 - Normal hoof growth
| Reading | Mean | S.D. |
|---|---|---|
| 23.05.84 | 4.77 | 2.62 |
| 20.06.84 | 5.69 | 1.83 |
| 18.07.84 | 6.71 | 2.16 |
| 15.08.84 | 6.56 | 2.37 |
| 12.09.84 | 6.43 | 1.73 |
| 10.10.84 | 4.76 | 1.54 |
| 07.11.84 | 5.14 | 1.83 |
| 05.12.84 | 5.03 | 1.96 |
| 01.01.85 | 4.68 | 1.78 |
| 30.01.85 | 3.92 | 2.25 |
| 27.02.85 | 3.88 | 2.24 |
| 27.03.85 | 4.90 | 2.01 |
| Total | 62.74 |
Figure 1. Shows the growth rate through the year for horses with normal feet. Growth rates have been plotted for the mean rate of growth at the toe and heel for all four feet. This group showed a mean growth rate of 0.19 mm growth per day with a maximum of 0.24 mm in June and a minimum of 0.14 in February.
Figure 2 - Laminitic hoof growth
| Reading | Mean | S.D. |
|---|---|---|
| 23.05.84 | 7.86 | 2.04 |
| 20.06.84 | 7.81 | 3.77 |
| 18.07.84 | 10.44 | 2.53 |
| 15.08.84 | 9.28 | 1.90 |
| 12.09.84 | 8.64 | 2.50 |
| 10.10.84 | 7.28 | 2.47 |
| 07.11.84 | 6.78 | 2.46 |
| 05.12.84 | 6.78 | 2.51 |
| 01.01.85 | 6.47 | 2.39 |
| 30.01.85 | 3.81 | 2.85 |
| 27.02.85 | 4.67 | 1.59 |
| 27.03.85 | 4.72 | 2.18 |
| Total | 84.54 |
Figure 2. Shows the mean growth rate for all readings of all four feet of the laminitic group. Although the peak growth rates are seen at a similar time of year, the laminitic feet showed a significantly greater growth rate except in January and March.
The laminitic group showed a mean growth of 0.25 mm per day with a maximum of 0.37 mm in July and a minimum of 0.14 in February.
Figure 3 - Toe Heel growth for all normal feet
| Reading | Toe (Mean) | S.D. | Heel (Mean) | S.D. |
|---|---|---|---|---|
| 23.05.84 | 5.08 | 2.79 | 4.61 | 2.51 |
| 20.06.84 | 5.81 | 1.88 | 5.63 | 1.80 |
| 18.07.84 | 7.28 | 1.85 | 6.43 | 2.25 |
| 15.08.84 | 6.50 | 2.11 | 6.64 | 2.49 |
| 12.09.84 | 6.58 | 1.70 | 6.35 | 1.74 |
| 10.10.84 | 5.00 | 1.41 | 4.64 | 1.59 |
| 07.11.84 | 5.19 | 1.92 | 5.11 | 1.78 |
| 05.12.84 | 5.92 | 1.68 | 4.58 | 1.93 |
| 01.01.85 | 4.81 | 1.64 | 4.61 | 1.85 |
| 30.01.85 | 4.08 | 2.34 | 3.83 | 2.20 |
| 27.02.85 | 4.19 | 2.39 | 3.72 | 2.14 |
| 27.03.85 | 5.39 | 2.00 | 4.65 | 1.98 |
| Total | 65.83 | 60.80 |
Figure 3. Shows a comparison of growth rate between the toe and heel of normal feet, a slight greater rate of horn growth was observed at the toe.
Figure 4 - Toe & Heel growth for all laminitic feet
| Reading | Toe (Mean) | S.D. | Heel (Mean) | S.D. |
|---|---|---|---|---|
| 23.05.84 | 7.00 | 1.77 | 8.29 | 2.03 |
| 20.06.84 | 6.92 | 4.05 | 8.25 | 3.55 |
| 18.07.84 | 8.92 | 2.63 | 11.21 | 2.25 |
| 15.08.84 | 8.08 | 1.75 | 9.88 | 1.69 |
| 12.09.84 | 7.50 | 2.36 | 9.21 | 2.38 |
| 10.10.84 | 5.92 | 2.09 | 7.96 | 2.37 |
| 07.11.84 | 5.25 | 1.73 | 7.54 | 2.41 |
| 05.12.84 | 6.50 | 1.89 | 6.92 | 2.76 |
| 01.01.85 | 6.58 | 2.36 | 6.42 | 2.41 |
| 30.01.85 | 3.00 | 2.34 | 4.21 | 2.99 |
| 27.02.85 | 3.50 | 1.11 | 5.25 | 1.47 |
| 27.03.85 | 4.42 | 1.38 | 4.88 | 2.47 |
| Total | 73.59 | 90.02 |
Figure 4. Shows a comparison of growth rate between toe and heel in the laminitic group and it is apparent even, with this small survey number that there is significantly more growth at the heel of the foot than at the toe. While growth rate at the toe was not impaired by the feet having chronic laminitis.
When figures 3 & 4 are compared, it is apparent that the toe grows more rapidly in the laminitic foot, but the major variation in growth is in the heel where growth rate was occasionally almost double that of the normal group.
Figure 5 - Front - Hind feet in normal horses
| Reading | Front (Mean) | S.D. | Hind (Mean) | S.D. |
|---|---|---|---|---|
| 23.05.84 | 5.00 | 2.14 | 4.54 | 2.80 |
| 20.06.84 | 5.85 | 2.06 | 5.52 | 1.54 |
| 18.07.84 | 6.70 | 2.18 | 6.72 | 2.14 |
| 15.08.84 | 6.87 | 1.88 | 6.24 | 2.74 |
| 12.09.84 | 6.59 | 1.85 | 6.26 | 1.58 |
| 10.10.84 | 5.02 | 1.39 | 4.50 | 1.64 |
| 07.11.84 | 4.69 | 1.87 | 5.31 | 1.77 |
| 05.12.84 | 4.96 | 1.99 | 5.09 | 1.77 |
| 01.01.85 | 5.04 | 1.80 | 4.31 | 1.69 |
| 30.01.85 | 3.72 | 2.00 | 4.11 | 2.46 |
| 27.02.85 | 3.94 | 2.15 | 3.81 | 2.32 |
| 27.03.85 | 4.69 | 1.88 | 5.11 | 2.12 |
| Total | 63.34 | 61.52 |
Figure 5. In the normal group the mean growth of the front feet was 2.95% greater than that of the hind feet over the twelve month period.
Figure 6 - Front & Hind laminitic feet
| Reading | Front Mean | S.D. | Hind Mean | S.D. |
|---|---|---|---|---|
| 23.05.84 | 8.00 | 2.16 | 7.72 | 1.90 |
| 20.06.84 | 8.44 | 4.01 | 7.17 | 3.40 |
| 18.07.84 | 10.78 | 2.75 | 10.11 | 2.23 |
| 15.08.84 | 9.44 | 1.94 | 9.11 | 1.85 |
| 12.09.84 | 8.50 | 2.36 | 8.78 | 2.63 |
| 10.10.84 | 7.78 | 2.59 | 6.78 | 2.24 |
| 07.11.84 | 7.33 | 2.80 | 6.22 | 3.61 |
| 05.12.84 | 7.06 | 2.27 | 6.50 | 2.71 |
| 01.01.85 | 6.22 | 2.29 | 6.72 | 2.46 |
| 30.01.85 | 4.94 | 2.69 | 2.67 | 2.53 |
| 27.02.85 | 4.67 | 1.82 | 4.67 | 1.33 |
| 27.03.85 | 4.67 | 2.18 | 4.78 | 2.17 |
| Total | 87.83 | 81.23 |
Figure 6. In the front and hind feet of the laminitic group the growth rate in the front feet was even greater than that in the hind, with a growth of 8% difference over the twelve month period.
Figure 7 - Normal medial & lateral heels
| Reading | Medial Mean | S.D. | Lateral Mean | S.D. |
|---|---|---|---|---|
| 23.05.84 | 5.18 | 3.01 | 5.25 | 3.03 |
| 20.06.84 | 6.20 | 2.29 | 6.10 | 2.50 |
| 18.07.84 | 7.28 | 2.79 | 6.68 | 2.66 |
| 15.08.84 | 7.35 | 3.20 | 7.15 | 2.28 |
| 12.09.84 | 6.53 | 1.99 | 7.08 | 2.31 |
| 10.10.84 | 5.43 | 2.08 | 4.68 | 1.83 |
| 07.11.84 | 5.38 | 1.52 | 5.33 | 2.22 |
| 05.12.84 | 4.98 | 2.24 | 4.83 | 2.01 |
| 01.01.85 | 5.15 | 2.23 | 5.00 | 2.28 |
| 30.01.85 | 4.40 | 2.52 | 4.33 | 2.76 |
| 27.02.85 | 4.30 | 2.27 | 3.55 | 1.97 |
| 27.03.85 | 4.33 | 1.45 | 5.35 | 2.39 |
| Total | 66.51 | 65.33 | ||
Figure 7. Growth rates between medial and lateral heels of the normal group showed no significant difference.
Figure 8 - Laminitic medial & lateral heels
| Reading | Medial Mean | S.D. | Lateral Mean | S.D. |
|---|---|---|---|---|
| 23.05.84 | 8.17 | 1.81 | 8.42 | 2.21 |
| 20.06.84 | 7.08 | 2.62 | 9.42 | 3.94 |
| 18.07.84 | 11.00 | 2.79 | 11.42 | 1.49 |
| 15.08.84 | 9.58 | 1.44 | 10.17 | 1.86 |
| 12.09.84 | 8.83 | 2.19 | 9.58 | 2.49 |
| 10.10.84 | 7.42 | 2.13 | 8.50 | 2.46 |
| 07.11.84 | 7.25 | 2.83 | 7.83 | 1.86 |
| 05.12.84 | 6.25 | 2.52 | 7.58 | 2.84 |
| 01.01.85 | 6.83 | 2.73 | 6.00 | 1.95 |
| 30.01.85 | 3.92 | 2.59 | 4.50 | 3.32 |
| 27.02.85 | 4.92 | 1.44 | 5.58 | 1.44 |
| 27.03.85 | 5.17 | 2.44 | 4.58 | 2.46 |
| 86.42 | 93.58 |
Figure 8. Growth rates between the medial and lateral heels of the laminitic group differed by 8.28%.
Discussion
It has long been accepted that the growth rate of horn varies with the season, and this could be controlled by temperature or by food intake. Previous studies (Butler and Heinz 1977) have shown that growth rate can be markedly affected by food intake. This study confirmed that toe growth appears to be slightly greater in the toe than the heel of the normal front foot while no significant difference between the toe and heel in the hind foot was found. In the unshod state this would help compensate for the increased wear seen on the toes of the feet of an unshod horse and might also compensate for the horse carrying a greater proportion of his weight on the forefeet. In the shod animal however these differences in growth rate are probably counter productive, since the shod foot tends to wear more at the heel than at the toe and thus both wear and growth patterns tend to result in lengthening of the toe in proportion to the heels over the period between shoeings.
Significantly increased growth rates were seen in the heels of laminitic feet. It is interesting to note however that growth at the toes is also marginally increased. The mechanisms of this are uncertain. Ackermann, Garner, Coffman and Clement (1975) showed areas of reduced vascularisation in the laminae of the toe of the foot in laminitis. Colles, Garner and Coffman (1979) suggested there was little alteration in the overall perfusion of the horse's foot in chronic laminitis again assessing the foot using angiography. These studies suggested that changes in growth rate may not be due to blood flow, however they primarily assessed the supply within the foot and the sensitive laminae, Leach (1980) concluded that the production of horn to the hoof wall was entirely from the coronary band and so blood flow through the foot therefore might have no affect on growth rate of the horn. This paper shows clearly that growth rate of the hoof wall is markedly increased after laminitis and is more particularly marked in he heels of the foot. The mechanisms by which such growth is increased however must remain speculative. It is also interesting to note that the lateral heels grew faster in the chronic laminitic foot.
Studies of growth rate are of considerable significance in terms of farriery. The results clearly suggest that the optimum time for shoeing horses will vary with the season of the year, and shoeing should probably be more frequent in the summer than winter. In the chronic laminitic it is essential to maintain the feet in a normal shape as possible, and excessive height in the heels may encourage further rotation of the distal phalanx. This study indicates that shoeing of the chronic laminitic should be considerably more frequent than of the normal horse and indeed shortly after a laminitic attack heel growth rates may approach 0.5 mm per day which might necessitate re-shoeing in as little as two or three weeks in critical cases.
Acknowledgment
I would like to thank Chris Colles MRCVS for his considerable help in the preparation and writing of this paper.
Tom Ryan FWCF
References
- O R Adams Lameness in horses (1974), Lea & Febiger, Philadelphia, USA.
- K D Butler & H F Hintz, Effect of level of feed intake and gelatin supplementation on growth and quality of hooves of ponies, Journal of Animal Science, Vol.44 No.2 (1977) Page 257.
- R O Shannon & K. D. Butler, Influence of age, season and hoof location on equine hoof growth, American Farriers' Journal, June 1979._page 44.
- Summinger 1977
- Butler 1976
- Grade & Saltzmann (1985)
- Ackermann, Garner, Coffman & Clement (1985)
- Colles, Garner & Coffman (1979)
- Leach (1980)
First published in the UK, in Forge 89 Magazine Issue 5, Page 11, (Revised for Web 12/11/2005)
Updated: 19/01/2023